


After the preliminary screening to eliminate spurious data, 1446 observation records were retained. The general statistics of the FWHM measurements is:
Average: 0.79 arcsecBecause tracking and guiding errors are not corrected by a fast tilting mirror as it was the case with HRCam, the FOCam image sizes are larger than the ones obtained by HRCam and also show a higher dependency on wind speed:Median: 0.75 arcsec
Rms: 0.205 arcsec
Minimum: 0.32 arcsec
Median for U < 3 m/s: 0.74 arcsecFig.Median for 3 < U < 6 m/s: 0.75 arcsec
Median for 6 < U < 10 m/s: 0.78 arcsec
Median for U > 10 m/s: 0.91 arcsec
 shows a scatter plot of FWHM values with respect to
 .
Only observations with
.
Only observations with  and U < 6 m/s are
plotted.
and U < 6 m/s are
plotted.  a trend to larger FWHM values can be noticed.
However the values of
a trend to larger FWHM values can be noticed.
However the values of  are less uniformly
scattered than it was the case with HRCam data: for
are less uniformly
scattered than it was the case with HRCam data: for  K
there are only three clusters of data each belonging to a
same observation sequence.
K
there are only three clusters of data each belonging to a
same observation sequence.
For  K, seeing even appears to decrease but the
scarcity of data does not allow us to attribute a
statistical significance
to the trend.
K, seeing even appears to decrease but the
scarcity of data does not allow us to attribute a
statistical significance
to the trend.
Fig. shows the scatter of FWHM values with respect to
the temperature difference  between the dome interior and the
outside air. The FOCam data also cover the range of positive
between the dome interior and the
outside air. The FOCam data also cover the range of positive
 up to 4K and, although here also the data points are
very unevenly scattered, no trends are apparent.
up to 4K and, although here also the data points are
very unevenly scattered, no trends are apparent.
[IMAGE ]
Figure: FWHM from the FOCam data
as a function temperature difference
 between the mirror surface and the surrounding air.
The full line represents a best fit of binned median values: for
between the mirror surface and the surrounding air.
The full line represents a best fit of binned median values: for
 the mirror seeing contribution
  is evaluated
0.3
is evaluated
0.3  .
The dashed line corresponds to a factor of 0.38, as obtained from
the HRCam data.
.
The dashed line corresponds to a factor of 0.38, as obtained from
the HRCam data.
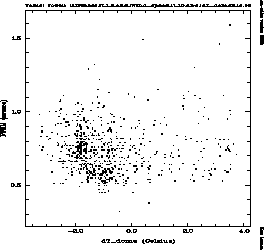
Figure: FWHM from the FOCam data
as a function of the temperature
difference  between dome interior and outside.
The airmass effect is then evaluated by analyzing a subset with
 0.3K and U < 6 m/s (fig. ).
Noting that the median FWHM for
0.3K and U < 6 m/s (fig. ).
Noting that the median FWHM for  is 0.71 arcsec,
a least square fit on the binned median values
gives a fixed error due to the instrument
is 0.71 arcsec,
a least square fit on the binned median values
gives a fixed error due to the instrument
 arcsec
while the airmass dependent variable is evaluated as
 arcsec
While we had expected the value of  from FOCam to be
larger that in
HRCam, we find that also the apparent natural seeing is
larger. Barring the possibility that HRCam can correct seeing image
motion to such an extent, this suggests the presence of mechanical effects
from the telescope which cause the tracking performance to depend
on orientation.
As the data set does not allow the discrimination of this particular effect,
we will proceed in the analysis on the basis of the values evaluated above,
since the effect of an inaccuracy in the relative weighting
on other seeing effects is anyway minor (see
equation ()).
from FOCam to be
larger that in
HRCam, we find that also the apparent natural seeing is
larger. Barring the possibility that HRCam can correct seeing image
motion to such an extent, this suggests the presence of mechanical effects
from the telescope which cause the tracking performance to depend
on orientation.
As the data set does not allow the discrimination of this particular effect,
we will proceed in the analysis on the basis of the values evaluated above,
since the effect of an inaccuracy in the relative weighting
on other seeing effects is anyway minor (see
equation ()).
Inserting the computed values of  and
and  in equation (), a least square fit on the
mirror seeing data (fig. ) gives for
in equation (), a least square fit on the
mirror seeing data (fig. ) gives for  :
:
One should remind that the value of this coefficient is
determined to a large extent by only three data sequences and therefore
carries less confidence than the value found in the HRCam case
(which was 0.38 arcsec/ ). Both trend lines are
drawn for illustration on fig. .
). Both trend lines are
drawn for illustration on fig. .
[IMAGE ]
Figure: FOCam FWHM versus  in absence of wind and mirror
seeing effects.
in absence of wind and mirror
seeing effects.
Fig. shows a scatter plot of FWHM with respect to wind speed.
This subset only includes data for which  and
and  K (562 records).
This plot shows the overall effect of wind on the FOCam
performance, averaging out the influence of relative azimuth of
observation with respect to wind direction.
Assuming that the median of the wind induced errors are
proportional to the square of wind speed
 a best fit of equation
 gives then

[IMAGE ]
Figure: FOCam FWHM versus wind speed.

![[IMAGE ]](img590.gif)
![[IMAGE ]](img606.gif)
![[IMAGE ]](img612.gif)