

Next: Pressure-speed correlation
Up: Wind tunnel measurements
Previous: Wind tunnel measurements
These wind tunnel tests were performed at the boundary layer wind
tunnel of the Danish Maritime Institute
as part of the test program
with the cylindrical enclosure selected for the VLT (see section
4.1.3).
The model included the same complete enclosure with a fully modeled
telescope inside it at a scale of 1:64 (see
fig.  ). The tests were run at a nominal
wind speed of about 12 m/s, with
several venting configurations of the enclosure as described in
section 4.1.3 above and covered the
range of wind directions 0, 10, 20, 40, 90 and 180
 in combination with telescope zenith angles of 10, 35 and 60
 .
Two types of measurements were performed:
- Measurements of the pressure difference between the upper and lower
faces of the primary mirror. Pressure taps were mounted on opposite sides
of the primary mirror at four symmetrical locations. The scanivalve setup
was such that instantaneous pressure differences were measured. These
instantaneous pressures were then expressed as coefficients
normalized by the reference external wind speed.
- Measurement of wind velocity close to the upper surface of the mirror,
by two single-wire hot-wire probes, respectively vertical and horizontal, located
about 10 mm (model scale) above the mirror surface.
Appendix  includes sketches with the location of the
measurement points and tables with the means, minima, maxima
and rms of all pressure coefficients and wind speed measurements close
to the mirror surface measured. The tables also give the peak frequency
(corrected for the 8-m full scale) of the pressure fluctuations. This
varies between 0.1 Hz and 0.6 Hz, which is the same range as found
at the dummy in the NTT, considering the factor 2 in geometric scale.
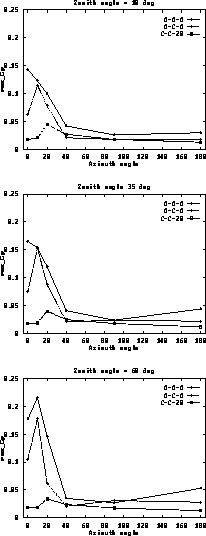
The measured rms of the pressure coefficients are plotted in
fig.
  versus the azimuth with the wind direction
for different telescope altitudes and enclosure configurations.

Figure: Plots of  (rms of
the pressure coefficients,
normalized to the external wind speed) versus the azimuth angle with
respect to the
wind direction for different telescope altitudes and enclosure
configurations (see the table at page
  ).
).


Next: Pressure-speed correlation
Up: Wind tunnel measurements
Previous: Wind tunnel measurements
Lorenzo Zago, lorenzo.zago@heig-vd.ch,
Mon Nov 6 23:33:14 GMT+0100 1995
 ). The tests were run at a nominal
wind speed of about 12 m/s, with
several venting configurations of the enclosure as described in
section 4.1.3 above and covered the
range of wind directions 0, 10, 20, 40, 90 and 180
 in combination with telescope zenith angles of 10, 35 and 60
 .
Two types of measurements were performed:


 (rms of
the pressure coefficients,
normalized to the external wind speed) versus the azimuth angle with
respect to the
wind direction for different telescope altitudes and enclosure
configurations (see the table at page