

Next: Synthesis
Up: Wind tunnel measurements
Previous: Pressure-speed correlation
Two important results were mentioned above:
- The deformations caused by wind buffeting are contained
in the basic (low order) elastic/optical modes of the mirror.
- The peak frequency of the pressure fluctuations was in the range
0.2 to 2 Hz at the NTT and in the range 0.07 and 0.56 Hz (full scale
for an 8-m mirror) in the wind tunnel tests.
Both these facts invite the possibility of considering a dynamic
corrections of the wind-buffet deformations of a large flexible mirror
by the active optics system (see page  ).
).
Recalling that existing active optics systems, such the one installed
on the NTT have a bandpass of about 1/30 Hz,
[Wilson 89] analyzes in some detail the possible implementation and
limitations of improved active optics systems
with an extended bandpass up to
1 Hz and eventually 10 Hz. Various technical solutions are proposed and it
is concluded that such systems are technically feasible.
It is therefore interesting to elaborate the test
results obtained during this work also in terms of the peak frequencies of
the pressure fluctuations on the mirror.
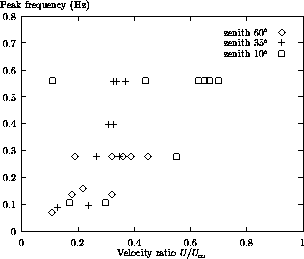
Fig.  presents a
scatter plot of peak frequencies versus the velocity ratio
 at an 8-meter primary mirror inside the cylindrical
enclosure.
The data include all test configurations with varying
azimuth angles and venting conditions and are here only separated
according to the pointing zenithal angle.
Recalling the relationship ( ) and that the
test wind speed was
about 12 m/s, we derive a range of turbulence length scales for the
pressure fluctuations between 0.9 and 3.6 m (full scale).
With respect to the mirror diameter the length scale range is then

During the mirror dummy tests at the NTT, the wind speed was not
measured close to the mirror, so that a similar analysis is
unfortunately not possible. However several power spectra of
pressure fluctuation measurements were evaluated ([Noethe 92])
in which
the peak frequency was within the range 0.2 to 2 Hz, which is exactly
the same (in view of the 1:2 geometrical
scale) as the range recorded in the cylindrical enclosure. This
confirms also with respect to the frequency characteristics
the general conclusion already drawn for modes and amplitudes of
wavefront fluctuations:
wind buffeting effects on the mirror depend first
on the geometrical scale and only to a smaller extent of particular
venting conditions.
We can then pragmatically conclude an upper bound for the worst case peak
frequency of pressure fluctuations on a primary mirror, which is quite
independent on the particular pointing angle or venting configuration:

This result, which stipulates that the peak frequency of significant
wind buffeting effects on a large telescope mirror will in no
case exceed the range of 1 to 2 Hz, will hopefully encourage the
development of active optics systems into a frequency bandwidth
which should be realistically achievable with present state
technology.

Figure: Scatter plot of peak frequencies versus the velocity ratio
 . The frequency data were obtained by visual interpretation
of the power spectra reported in the test report [DMI].


Next: Synthesis
Up: Wind tunnel measurements
Previous: Pressure-speed correlation
Lorenzo Zago, lorenzo.zago@heig-vd.ch,
Mon Nov 6 23:33:14 GMT+0100 1995
 presents a
scatter plot of peak frequencies versus the velocity ratio
 at an 8-meter primary mirror inside the cylindrical
enclosure.
The data include all test configurations with varying
azimuth angles and venting conditions and are here only separated
according to the pointing zenithal angle.


 . The frequency data were obtained by visual interpretation
of the power spectra reported in the test report [DMI].