


The following table shows the averages  (referred to
  and which, as mentioned above, are only
approximately accurate) and the averages
and which, as mentioned above, are only
approximately accurate) and the averages  of the rms
pressure coefficients
in the NTT for
of the rms
pressure coefficients
in the NTT for  and various
zenith angles
and various
zenith angles  .
.
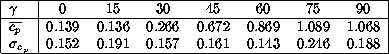
Whereas the average pressure  depends
strongly on the inclination
depends
strongly on the inclination  of the dummy, the
pressure variations
of the dummy, the
pressure variations  are virtually
independent of
are virtually
independent of  .
.
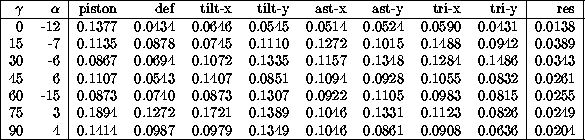
The following table shows as an example the rms
values
 of the
temporal variations of the normalized modal coefficients and of
the residual rms
for the measurements in which
of the
temporal variations of the normalized modal coefficients and of
the residual rms
for the measurements in which  is
is
 with various zenith angles
  .
They are for all
.
They are for all  of the same order of magnitude.
The data for defocus and astigmatism can be compared with the
corresponding data from the LASEN wind tunnel experiments
(fig.  ).
A comparison with figure , where the data have to
multiplied by two for defocus and about
).
A comparison with figure , where the data have to
multiplied by two for defocus and about  for astigmatism,
shows indeed the good agreement between the two experiments.
for astigmatism,
shows indeed the good agreement between the two experiments.
The power spectra of the pressure at the locations of the 13 sensors
and those computed for the various modes depend strongly on  .
For
.
For  the highest energy density is at about 0.2
Hz. For smaller zenith angles the turbulence is shifted to much higher
frequencies up to about 2 Hz.
the highest energy density is at about 0.2
Hz. For smaller zenith angles the turbulence is shifted to much higher
frequencies up to about 2 Hz.