

The computation was done with a data set including night-time wind and natural seeing data at the Cerro Paranal site for an entire year. Only the periods in which the mean wind speed exceeded 18 m/s were excluded as in those conditions the telescope would not be observing.
The table below shows the time percentages of the different configuration of the VLT enclosure, assumed to be operated with the criterion to limit the pressure fluctuations on the primary mirror.

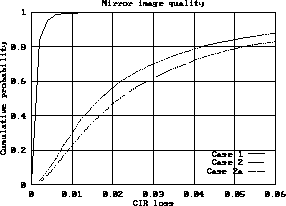
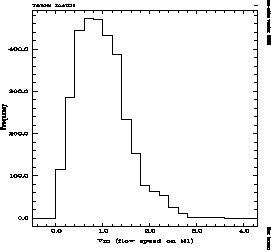
In fig. 6.5 the (1) curve shows the cumulative distribution of the CIR loss due only to wind buffeting on the primary mirror. One may note that during most of the time the mirror aberration remains well below the budget value (1%) while the mean wind speed on the mirror (fig. 6.6) has its statistical median at about 1 m/s.
Mirror seeing will depend on the mirror temperature which is in the
VLT case an independent variable since the mirror will be actively
cooled. The cooling system must be sized to cope with the changes of
ambient air temperature and it is of interest to evaluate the maximum positive mirror-air
 allowed by the error budget. This is found to be at least
0.5 K.
The cumulative distribution of the CIR loss due to wind
buffeting plus mirror seeing with a (constant)
  of
0.5 K is found in fig. 6.5 (curve 2):
the total mirror CIR loss would be below the budget of 3%
for about 70% of the time.

Figure: Cumulative distribution of the CIR loss:
 of 0.5 K.

Figure 6.6: Histogram of the mean wind speed distribution
on the primary mirror
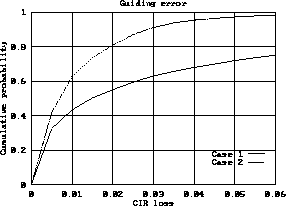
The predicted statistical distribution of the guiding performance for observations in the infrared without field stabilization is found in fig. 6.7 (curve 1). One will note that for the performance will be within the budget (2.5%, see fig. 6.4) only 60% of the time. To try to improve the situation one may decide to set the guiding performance instead of the buffeting on the mirror as the criterion for closing the louvers and raising the windscreen of the enclosure. In this case the distribution of enclosure configurations will be as follows:

The wind speed inside the enclosure will
generally be smaller than with the previous strategy. Wind buffeting
on the mirror will be even less significant
but the slower wind flow will require
that the mirror temperature is, on average, closer to the one
of ambient air than in
the previous case. Indeed a simulation run with the same positive
 of 0.5 K results in a somewhat worse distribution of mirror
image quality as shown by the curve (2a) in
fig. 6.5.

Figure: Cumulative distribution of the CIR loss due to guiding errors:


